Do you know what your ideal stroke rate (cadence) is for racing events of 1,500-4000m?
This set will help you find your stroke rate sweet spot for races of those distances.
What’s the set?
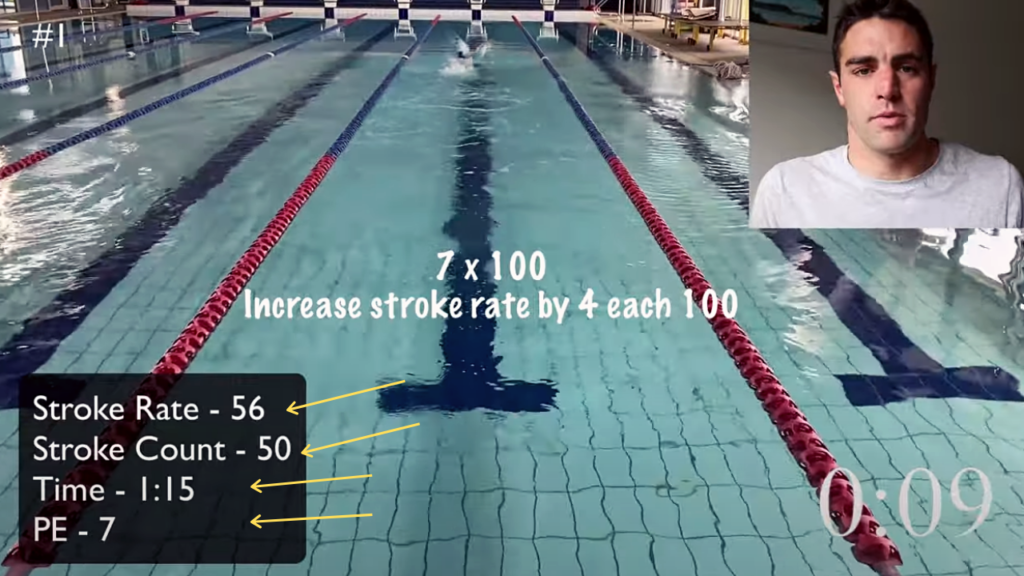
7 x 100 Freestyle with 0:30 secs rest
– Using a FINIS tempo trainer, increase your stroke rate by 4 each 100 (Use the guide below to choose your stroke rate for the first 100)
– Record time, stroke rate, stroke count and perceived effort
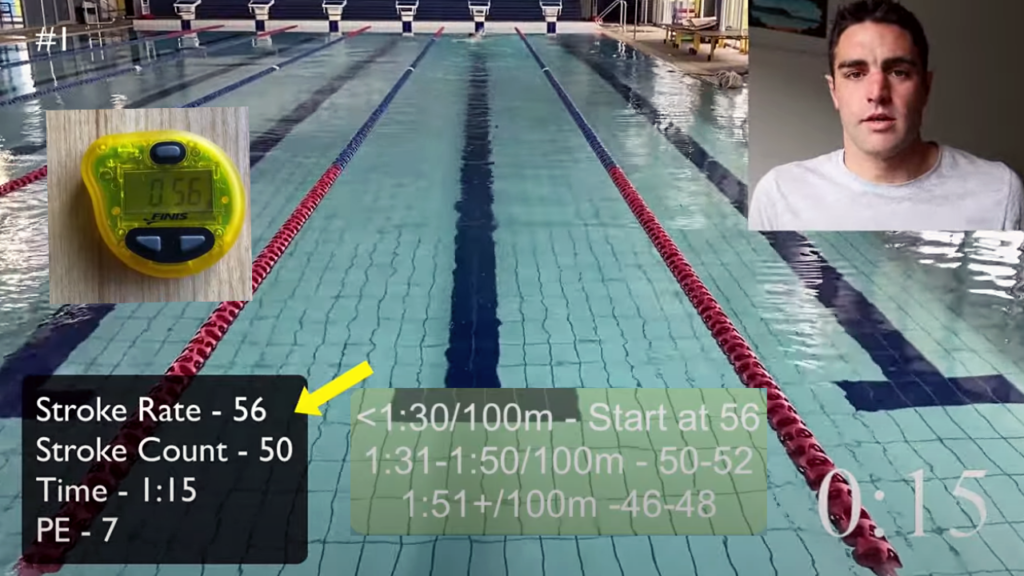
How to choose the stroke rate for your first 100m:
Race pace (per 100m) – Stroke rate for 1st 100m
>2:15 – 44
1:50-2:15 – 48
1:30-1:49 – 52
<1:30 – 56
Note: One arm stroke equals one stroke. Some coaches will count a stroke cycle (two individual strokes) as one but for the purpose of simplicity we are counting a left arm stroke as one stroke and a right arm stroke as another.
I’ve created a spreadsheet that will help you record all of these things and determine what stroke rate is the best for you. You can download it here.
In each 100m you record your:
– Time
– Stroke rate
– Stroke count
– Perceived effort
We’re looking for a stroke rate where your stroke count and perceived effort is the same or lower than other stroke rates for a quicker time.
I began at a 56 stroke rate which I would recommend if your race pace is 1:30/100m or quicker. Use the guide above to select your initial stroke rate. This is only a guide but is accurate for most swimmers.
You’ll need a FINIS Tempo Trainer to accurately swim with the correct stroke rate. This is a training device that emits an audible beep each time you should take a stroke. It will help you train and become familiar with the stoke rate that you want to race at. You can set it to beep ‘X’ amount of times per minute and wear it underneath your swim cap so that you can match the stroke with the beep that it’s making.
Note: I use it on Setting 3 for this set
One of the main things that we want to look for is a ‘sweet spot’. A point in the graph where your perceived effort and stroke count is lower for a better return on your time.
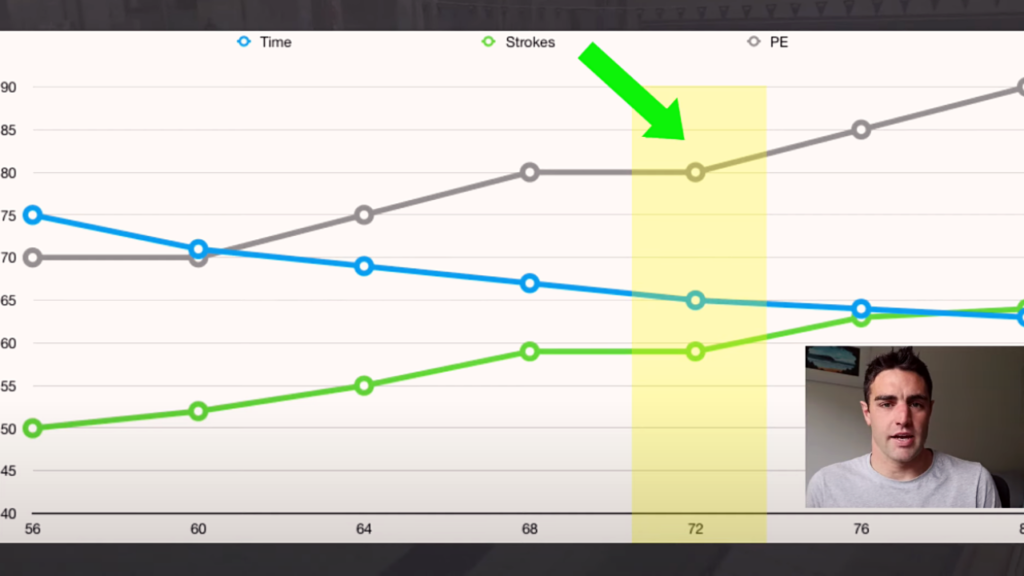
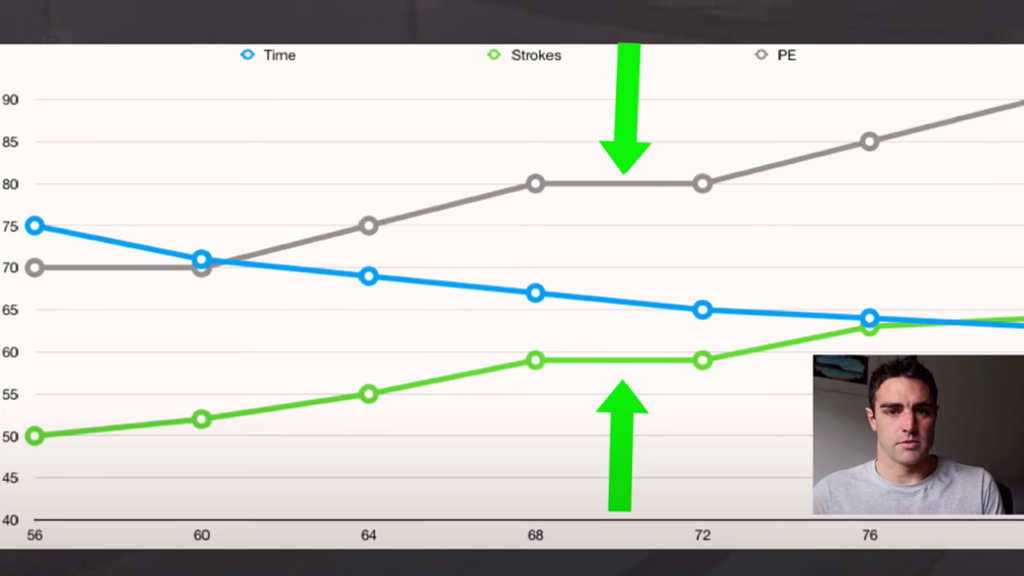
For me, my sweet spot happens to be around 72 strokes per minute. It is where my perceived effort was 8/ 10, my time was a 1:05, and the stroke count was 59. You can see at a stroke rate of 68 my time was a 1:07, but was the same perceived effort and stroke count. When you look at the graph, there is a small slope or dip where it doesn’t actually come up. So the time comes down, the stroke count, the perceived effort stays the same.
Click here to download a copy of this spreadsheet. Enter your email address and I will send you a copy of the spreadsheet where you can enter your data into it and start identifying what stroke rate is ideal for you.
Troubleshooting this set:
- If your times are getting slower as you increase your stroke rate, start at a lower stroke rate for your first 100m. It means you’re ‘spinning the wheels’ and have lost the efficiency in your technique.
- It’s not set and forget – As you increase your endurance, improve your technique and develop as a swimmer your ‘sweet spot’ will change slightly.
- Can’t increase stroke rate without ‘spinning wheels’? – One way to increase your rating is to speed up your recovery over the water and start the catch a bit sooner, but don’t speed up the pull phase of the stroke.